Simple, easy-to-use Windows-based software.
The data logger software is designed to streamline the data download and review process in a user-friendly and time-efficient manner. The software offers many customizable features and options, including the ability to change physical units (depending on specific data logger models) to suit the user's needs.
All data loggers operate in a similar manner and are simple and easy to use. Each class of logger has a unique device type and is automatically identified in the software on the host computer.
Features:
Workflows
The Workflows feature allows you to automate tasks such as creating reports, downloading data, starting and stopping devices, or even sending emails – notifications!
Timestamps
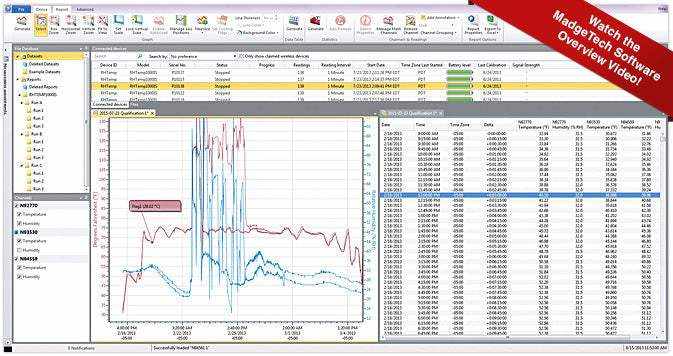
Appearing as a vertical line in a chart or a colored row in a data table, timestamps can help organize different stages or cycles within your processes or any reference points crucial for interpreting your data as desired.
Value lines
Select from a calculated value such as minimum, maximum, average or MKT for each parameter or reference a fixed position within the report as required.
Independently set scale units
Independently scalable channels that enable the simple presentation of complex information.
Copy to Excel
To view report data in a spreadsheet, users can export reports to Microsoft Excel®. Now equipped to handle millions of readings!
Graphic view
Take advantage of infinite graphical flexibility by combining channels and datasets as desired. All graphics utilize accelerated graphics hardware for real-time updates and high-performance visuals.
Data table reports
Using a data table report allows the user to view the data and channels from the current graph or statistics report in a data table format.
In addition, data table reports can also be exported to Microsoft Excel®.